
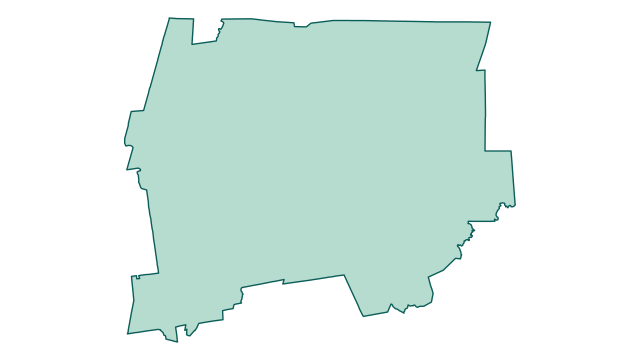
County outline
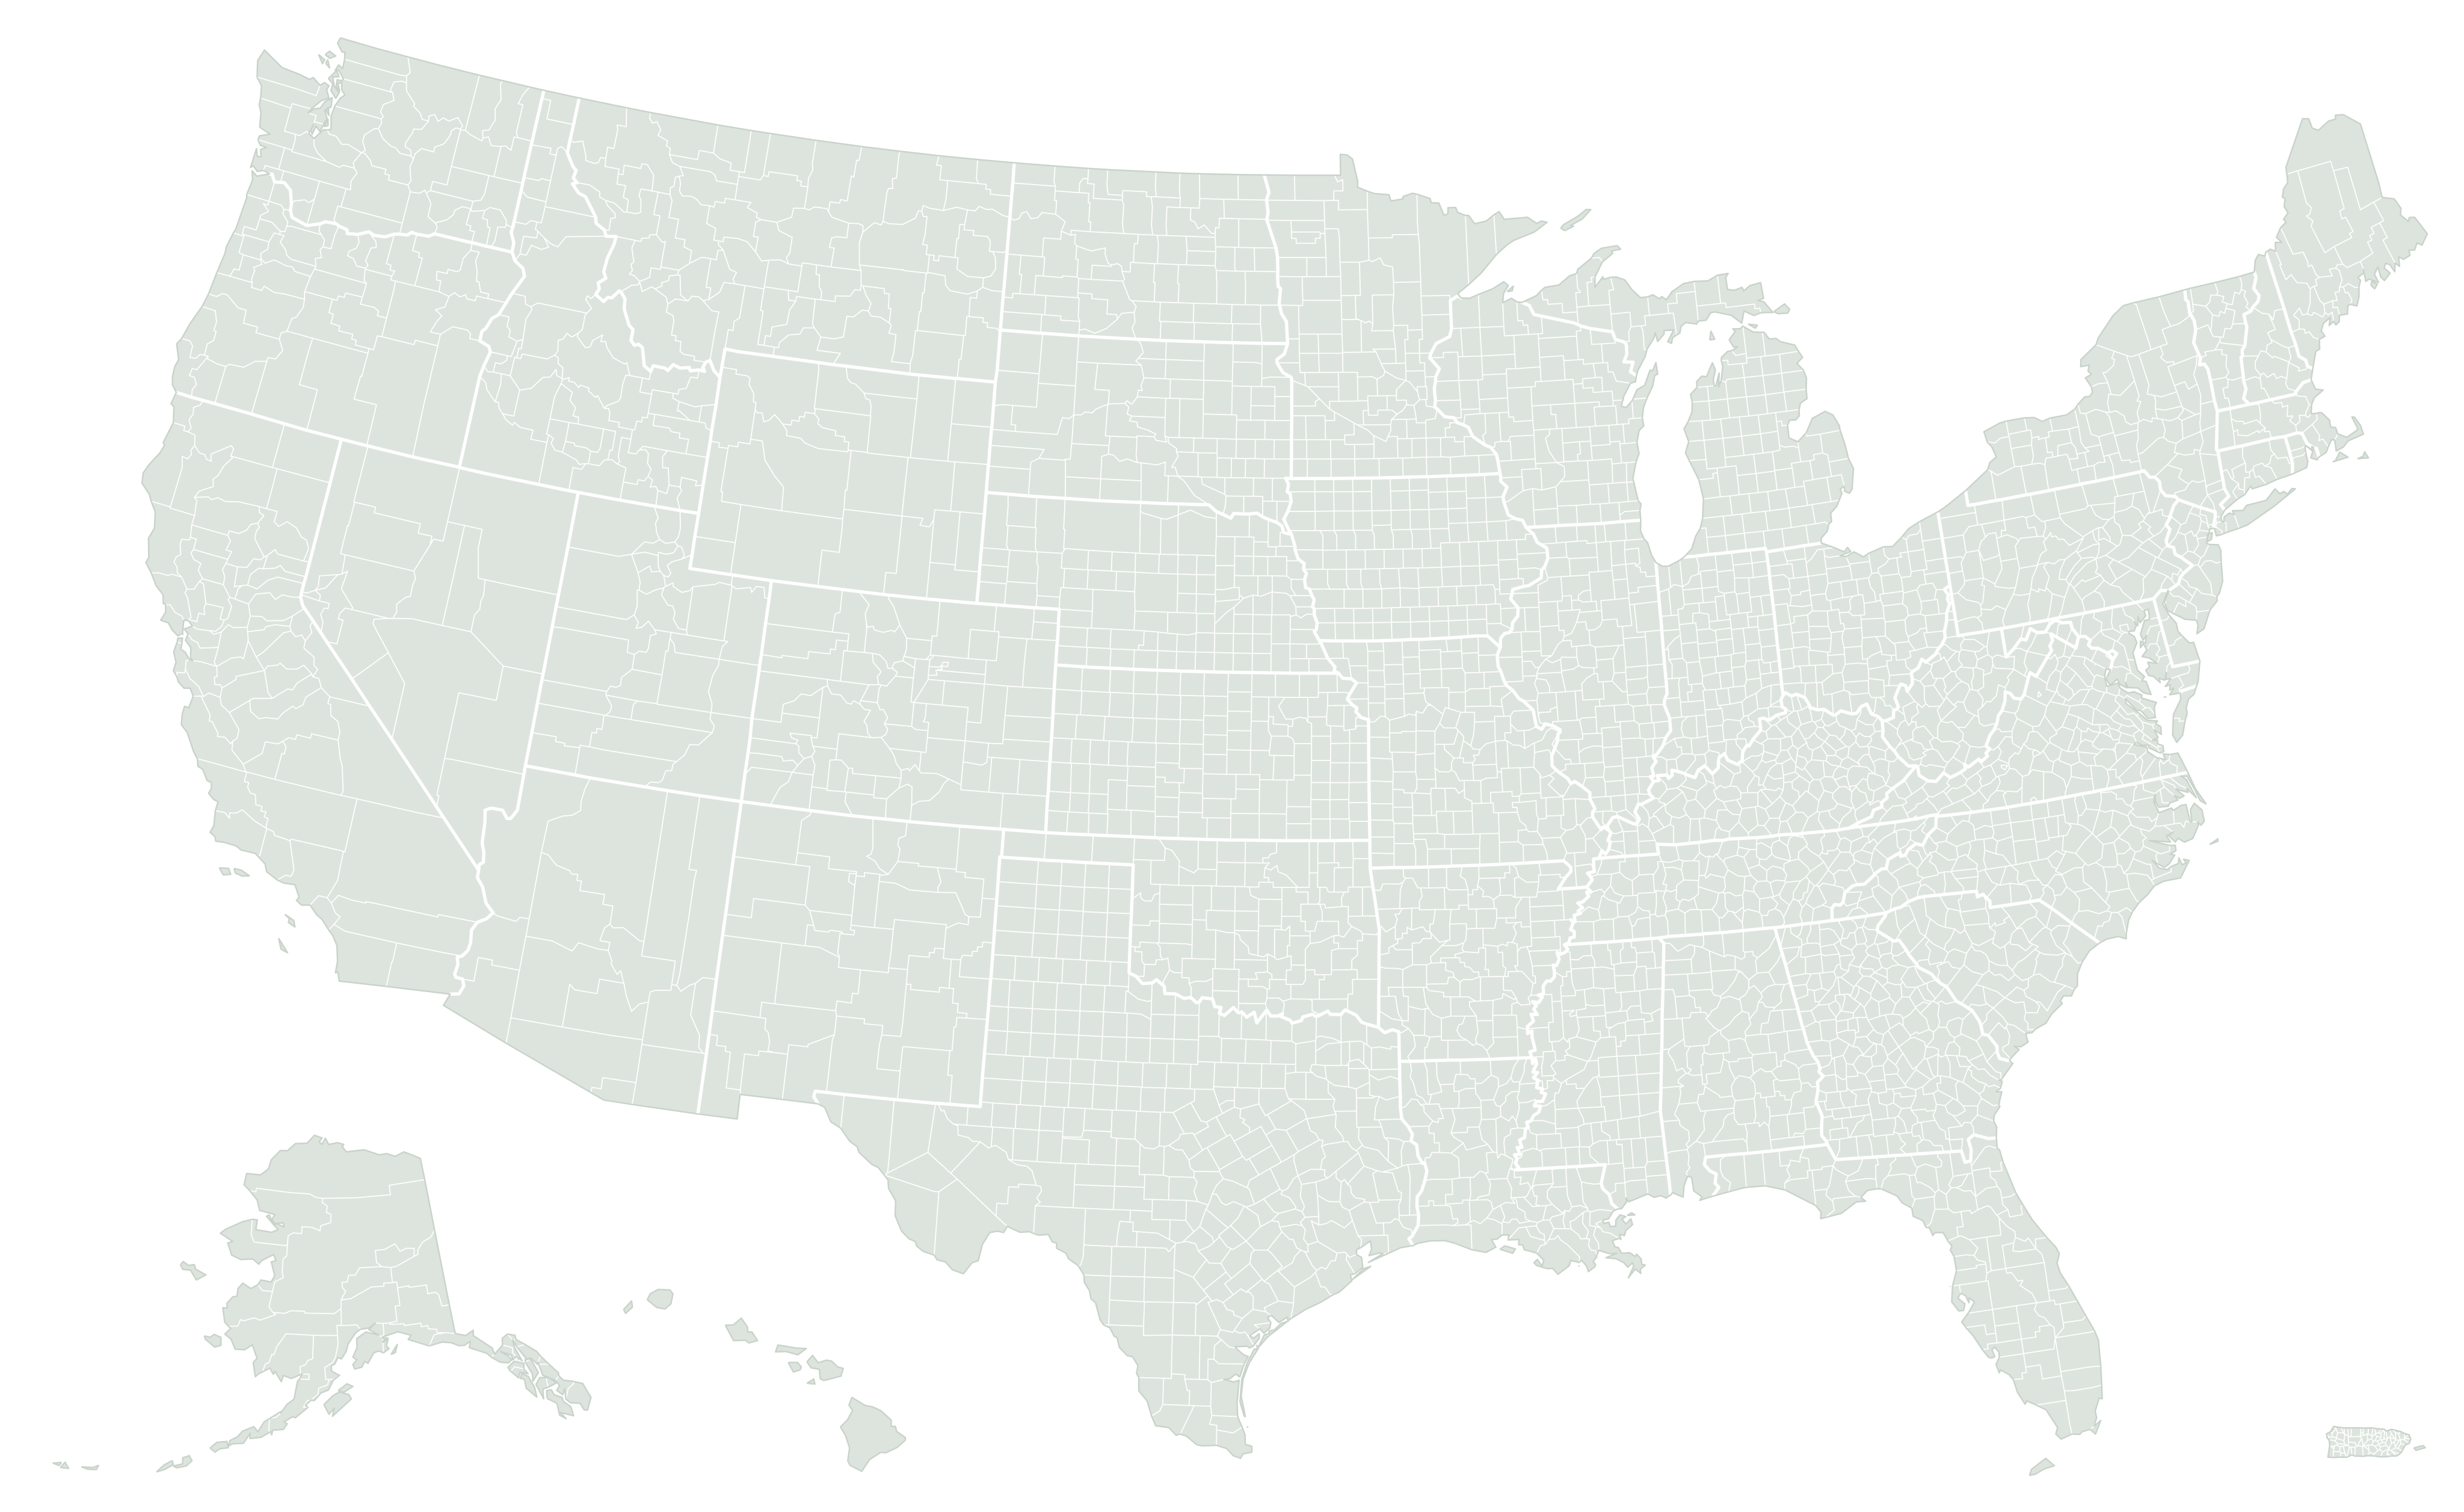
Where Capitol Planning Region is located
Area breakdown
Land accounts for 98.2% of Capitol Planning Region’s measured area and water for 1.8%. Its combined area converts to 2,709.6 square kilometers or approximately 669,559 acres.
Green: land · blue: water
| Measurement | Square miles | Square kilometers | Acres |
|---|---|---|---|
| Land | 1,027.359 | 2,660.848 | 657,509.8 |
| Water | 18.827 | 48.762 | 12,049.3 |
| Total | 1,046.186 | 2,709.609 | 669,559 |
How Capitol Planning Region compares
By original Census land area, Capitol Planning Region ranks #1 of 9 in Connecticut and #646 of 3,222 nationally. National rankings include the 50 states, District of Columbia, and Puerto Rico.
Its land area is 1.931 times the Connecticut county-equivalent median of 532.1 square miles. It accounts for 21.2% of the combined county land area in the state.
See the complete Connecticut ranking · What counts as a county equivalent?
Population and density of Capitol Planning Region
The Census Bureau estimates that 994,115 people lived in Capitol Planning Region on July 1, 2025. That ranks #51 of 3,222 county equivalents nationally and #1 of 9 in Connecticut. Since the April 1, 2020 estimates base of 977,686, the population has grown by 16,429 (+1.7%), compared with +2.2% for Connecticut as a whole.
With 1,027.4 square miles of land, that is 968 people per square mile (374 per km²), placing Capitol Planning Region #197 nationally for density and #5 in Connecticut. The median county equivalent has 47 people per square mile; the Connecticut median is 968. Put another way, there are about 0.661 acres of land per resident.
| July 1 | 2020 | 2021 | 2022 | 2023 | 2024 | 2025 |
|---|---|---|---|---|---|---|
| Estimate | 964,034 | 971,972 | 975,074 | 981,775 | 989,194 | 994,115 |
| Change | — | +7,938 | +3,102 | +6,701 | +7,419 | +4,921 |
U.S. Census Bureau, Vintage 2025 population estimates. Estimates are revised each year and are not decennial census counts. Density divides the whole population by the whole county’s land area, so it describes an average, not how settlement is distributed within the county. Population sources and methods.
Cities and towns in Capitol Planning Region
Capitol Planning Region is divided into 38 cities and towns. In Connecticut, county subdivisions are local governments, and together they cover all of the county’s land and residents.
The most populous is Hartford town, with 121,981 residents (12.3% of the county). The largest by land is Stafford town, at 58 mi², or 5.6% of the county’s land. Among those with at least 1,000 residents in 2020, Granby town grew fastest since then (+9.8%).
| County subdivision | Population 2025 | Since 2020 | Land mi² | Share of county land |
|---|---|---|---|---|
| Hartford town | 121,981 | +0.3% | 17.4 | 1.7% |
| New Britain town | 76,286 | +2.9% | 13.4 | 1.3% |
| West Hartford town | 64,242 | +1.1% | 21.8 | 2.1% |
| Manchester town | 59,773 | +0.1% | 27.4 | 2.7% |
| East Hartford town | 50,968 | −0.2% | 18 | 1.8% |
| Southington town | 44,242 | +1.7% | 35.9 | 3.5% |
| Enfield town | 41,142 | −2.3% | 33.3 | 3.2% |
| Glastonbury town | 35,503 | +1% | 51.3 | 5% |
| Newington town | 31,647 | +3.6% | 13.1 | 1.3% |
| Vernon town | 30,842 | +2.1% | 17.7 | 1.7% |
| Windsor town | 29,879 | +1.3% | 29.5 | 2.9% |
| Mansfield town | 29,062 | +6.9% | 44.6 | 4.3% |
| Farmington town | 28,632 | +7.2% | 27.9 | 2.7% |
| Wethersfield town | 27,291 | −0% | 12.3 | 1.2% |
| South Windsor town | 27,036 | +0.4% | 28 | 2.7% |
Show the other 23 subdivisions
| Name | Population 2025 | Since 2020 | Land mi² |
|---|---|---|---|
| Simsbury town | 25,582 | +4.4% | 33.9 |
| Bloomfield town | 22,267 | +3.4% | 26.1 |
| Rocky Hill town | 21,575 | +3.5% | 13.5 |
| Berlin town | 20,698 | +2.6% | 26.3 |
| Avon town | 19,096 | +0.8% | 23.2 |
| Plainville town | 17,746 | +1.2% | 9.707 |
| Ellington town | 16,594 | +1% | 34 |
| Suffield town | 16,046 | +1.8% | 42.3 |
| Tolland town | 14,752 | +1.2% | 39.7 |
| Windsor Locks town | 12,617 | +0.1% | 9.024 |
| Coventry town | 12,446 | +1.7% | 37.6 |
| Granby town | 11,963 | +9.8% | 40.7 |
| Stafford town | 11,721 | +2.2% | 58 |
| East Windsor town | 11,342 | +1.3% | 26.2 |
| Somers town | 10,938 | +6.6% | 28.5 |
| Canton town | 10,304 | +1.8% | 24.6 |
| Hebron town | 9,256 | +2% | 36.9 |
| Marlborough town | 6,213 | +1.2% | 23.4 |
| Willington town | 5,601 | +0.7% | 33.3 |
| East Granby town | 5,432 | +4% | 17.5 |
| Columbia town | 5,352 | +1.4% | 21.4 |
| Bolton town | 4,875 | +0.4% | 14.4 |
| Andover town | 3,173 | +0.7% | 15.4 |
Population: U.S. Census Bureau Vintage 2025 subcounty estimates, counting only the part of each subdivision inside Capitol Planning Region. Land: 2026 Census Gazetteer. How communities are listed.
Metropolitan area
Capitol Planning Region is a central county of the Hartford-West Hartford-East Hartford, CT Metropolitan Statistical Area. Its 2 county equivalents have 1,171,426 residents on 1,451.5 square miles of land; Capitol Planning Region accounts for 70.8% of the land and 84.9% of the residents. By combined land it ranks #228 of 393 metropolitan areas, and #51 by population. It belongs to the New Haven-Hartford-Waterbury, CT Combined Statistical Area.
| County equivalent | Population 2025 | Land mi² |
|---|---|---|
| Capitol Planning Region | 994,115 | 1,027.4 |
| Lower Connecticut River Valley Planning Region | 177,311 | 424.1 |
ZIP codes
74 ZIP Code Tabulation Areas have land in Capitol Planning Region; 71 of them have most of their land inside the county, and the others mainly cover neighboring areas.
0600106002060100601606019060200602206023060260602906032060330603506037060400604206043060510605206053060590606006062060660606706070060710607206073060740607606078060800608106082060840608506088060890609006092060930609506096061030610506106061070610806109061100611106112061140611706118061190612006226062310623206237062380624806250062680626906279064440644706451064670647906489
ZIP Code Tabulation Areas are the Census Bureau’s approximations of USPS ZIP Code service areas, from the 2020 Census relationship files. Lighter codes have less than half of their land in this county. Post-office-box and single-address ZIP Codes have no tabulation area. Connecticut areas are assigned through their towns, because planning regions replaced the state’s counties after 2020.
Counties bordering Capitol Planning Region
Capitol Planning Region shares a land border with 7 county equivalents, including 1 in Massachusetts. It has more land than every one of them. The largest neighbor is Northwest Hills Planning Region (786.6 mi²) and the smallest is South Central Connecticut Planning Region (367.3 mi²). Together with its neighbors, Capitol Planning Region forms a block of 4,787.2 mi² of land, of which it holds 21.5%.
| Bordering county equivalent | Land mi² | Size vs. Capitol | Compare |
|---|---|---|---|
| Northwest Hills Planning Region | 786.6 | 1.3× smaller | Compare |
| Hampden CountyMassachusetts | 617 | 1.7× smaller | Compare |
| Southeastern Connecticut Planning Region | 598.1 | 1.7× smaller | Compare |
| Northeastern Connecticut Planning Region | 553.9 | 1.9× smaller | Compare |
| Lower Connecticut River Valley Planning Region | 424.1 | 2.4× smaller | Compare |
| Naugatuck Valley Planning Region | 412.8 | 2.5× smaller | Compare |
| South Central Connecticut Planning Region | 367.3 | 2.8× smaller | Compare |
How big is Capitol Planning Region compared with U.S. states?
Capitol Planning Region has less land than any of the 50 states. Rhode Island, the smallest state by land area, has 1,033.9 mi², about 1 times as much. Connecticut’s county land could hold about 4.7 areas the size of Capitol Planning Region.
Another way to picture it: the same land area would fill a square about 32.1 miles (51.6 km) on each side. Real county shapes are rarely square, so this is a scale reference rather than a width or driving distance.
State figures are the sums of each state’s county-equivalent land measurements in the same Census release, so states and counties are compared on the same basis. Published state totals can differ slightly because of rounding. Compare all states · Counties bigger than entire states.
What stands out about Capitol Planning Region?
Capitol Planning Region has more land than 2,576 of the other 3,221 county equivalents in the dataset.
A median is the middle county-equivalent measurement, not the average of the largest and smallest. All three bars use the same linear scale. Very small areas may appear as a thin sliver; the labels retain their values.
Does including water change its rank?
Using land plus water places Capitol Planning Region at #724 nationally by total area, 78 places farther from the top than its land rank. Other county equivalents gain more area when their water measurements are included.
Its water share is 1.8%, compared with a national county-equivalent median of 1.2% — 0.6 percentage points higher. This describes the statistical geography’s land/water mix, not flood exposure or developable land.
Closest positions in the national land ranking
These entries sit immediately beside Capitol Planning Region in the national ranking. They can be in different states and are not necessarily geographic neighbors.
| Land rank | County equivalent | Land mi² | Comparison |
|---|---|---|---|
| #645 | Westmoreland County, Pennsylvania | 1,027.7 | Compare |
| #646 | Capitol Planning Region, Connecticut | 1,027.4 | This county |
| #647 | Monroe County, Alabama | 1,025.7 | Compare |
Calculated from the same Census release as the area table. Total-area order uses original ALAND + AWATER; water shares and chart labels use published square miles. Calculation details.
Representative coordinates
The Census internal point is 41.816970, -72.575886. It represents a location inside the geography; it is not necessarily the centroid or the address of a courthouse.
Source and precision
U.S. Census Bureau, 2026 Gazetteer Files, Counties. Original ALAND: 2,660,846,205 m²; AWATER: 48,762,506 m². Rankings use ALAND; exact ties use ascending GEOID. Tables preserve Census-published square miles to three decimals, with conversions based on those values.
Common questions
How big is Capitol Planning Region?
Capitol Planning Region, Connecticut has 1,027.4 square miles (2,660.8 km²) of land and 18.8 square miles of water, for a total area of 1,046.2 square miles. It ranks #646 of 3,222 U.S. county equivalents by land area.
Is Capitol Planning Region the largest county in Connecticut?
Yes. Capitol Planning Region has the most land of the 9 county equivalents in Connecticut.
What counties border Capitol Planning Region?
Capitol Planning Region shares a land border with Hampden County, Massachusetts, Northwest Hills Planning Region, Southeastern Connecticut Planning Region, Northeastern Connecticut Planning Region, Lower Connecticut River Valley Planning Region, Naugatuck Valley Planning Region, and South Central Connecticut Planning Region.
What is the population of Capitol Planning Region?
The Census Bureau estimates Capitol Planning Region had 994,115 residents on July 1, 2025, ranking #51 of 3,222 county equivalents. That is 968 people per square mile of land.
What cities and towns are in Capitol Planning Region?
Capitol Planning Region has 38 county subdivisions (cities, towns and townships). The most populous five are Hartford town, New Britain town, West Hartford town, Manchester town, and East Hartford town.
Is Capitol Planning Region part of a metropolitan area?
Yes. It is a central county of the Hartford-West Hartford-East Hartford, CT Metropolitan Statistical Area, which has 2 county equivalents and 1,171,426 residents.
How many ZIP codes are in Capitol Planning Region?
74 ZIP Code Tabulation Areas have land in Capitol Planning Region, and 71 of them have most of their land inside the county. Census ZIP Code Tabulation Areas approximate USPS ZIP Code areas.
How does Capitol Planning Region compare with U.S. states?
It has less land than every state. Rhode Island, the smallest, has 1 times as much land.
How many acres of land are in Capitol Planning Region?
The land measurement converts to approximately 657,510 acres. Including water, total area is approximately 669,559 acres. One square mile equals 640 acres.
Why might another source show a different area?
Check whether it reports land or total area, its Census vintage, and its rounding. Our guide explains how to reconcile county area figures.
Can this establish a property boundary?
No. Statistical measurements and generalized maps do not establish property lines. Consult the relevant local surveying or land-records authority.